Another "bone-crushing" technical article. If math is not your thing, you may want to just check out the first and last sections and move along.
1. Introduction
Following the 1994 World Championships in Chiba we conducted a small statistical analysis of the judges' ordinals, motivated by the extensive criticism of dance judging prevalent at the time We were curious if there were any quantitative differences between the marking habits of dance judges versus judges in singles and pairs. It was found at the time that there were indeed statistically significant differences in the way dance judges score a competition. These differences were later confirmed by examining the ordinals at subsequent World Championships.
Inspired by the extensive criticisms of the current scoring method during the past season and by recent discussions of various proposals to change the scoring system, we decided to revisit the question of how judges really mark a competition by conducting a more extensive statistical analysis of judges' marks. The following analysis is based on the judges marks from the free skating and free dance competitions at the 1997 World Championships in Lausanne. This analysis is consistent with the more limited studies from previous years, providing a four year basis over which to draw conclusions.
In the following, keep in mind that the characteristics of the judges marks' to be described are applicable only to the judging of senior level events at the highest level of international competition.
2. Ordinals
At a skating competition one of the two most common types of results sheets posted is the list of judges ordinals. This sheet shows the places each judge assigned each skater in the event. Less often seen, but sometimes also posted are the individual marks assigned by the judges. At major competitions all of the judges' marks and ordinals for all the events are also published together in a book called the "protocol" which can be purchased at the end of the competition. A quick look at the ordinal sheets gives a quick indication of the consistency of the judging, but a great deal more can be learned about judging by digging a little deeper into the marks and ordinals assigned. We begin, however, with the ordinals.
One way of characterizing the diversity of opinion in an event is to look at the spread of the ordinals for each place. We do this by first converting the ordinals to "deviations". The deviations for each judge are the differences between the ordinals assigned by the judge for each skater and the actual placement of the skater by the whole panel. For example, if an ordinal assigned by a judge is the same as the skater's place in the event the deviation is 0, if the judge places the skater one place lower than the panel the deviation is +1, or if one place higher -1.
The next step is to combine the deviations together for each place. This is done by taking the deviations for all the judges for each place and calculating what is called the "root mean square" (rms) deviation. In the rms deviation we multiply each deviation by itself (square it), then average the squares, and then take the square root. The resulting number characterized the spread in the deviations, and hence the spread in the judges' ordinals. The bigger the value of the rms deviation the bigger the spread in the ordinals, and hence the greater the diversity of opinion among the panel.
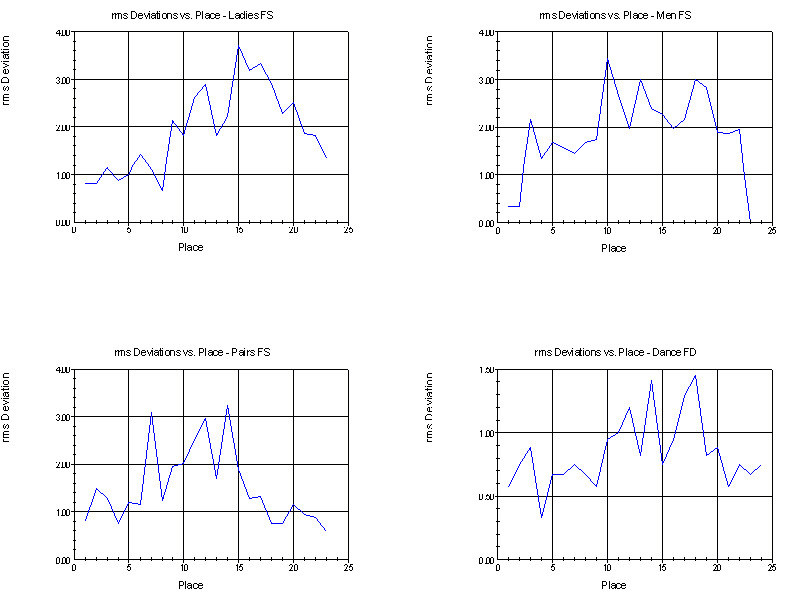
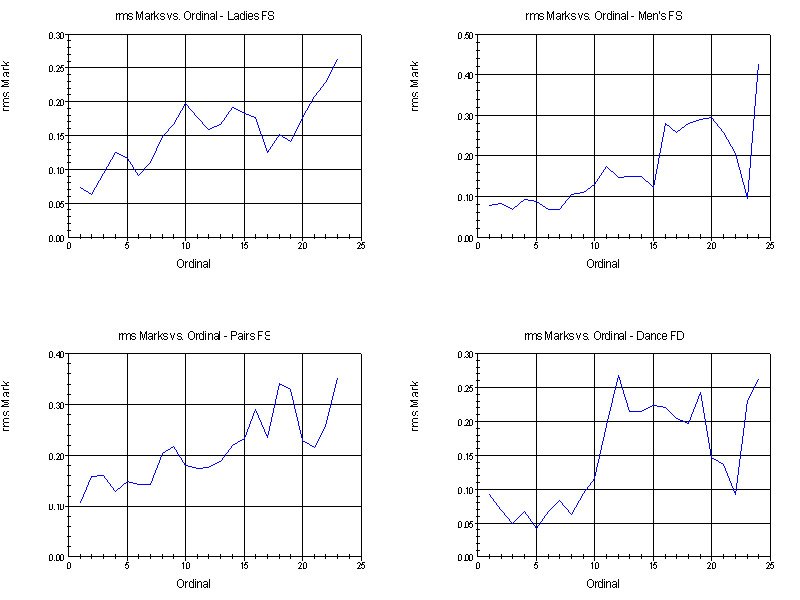
The following graphs show the rms deviations for the free skating and free dance events as a function of place. The y-axis is the value of the rms deviation and the x-axis spans each place in the events from first to last. There were 23 competitors in the Men's and Pairs final round, and 24 in the other events. [In the following when we refer to the highest places we mean in terms of order of finish not the place number; i.e., first place is the highest place and last place is the lowest place.]
Notice that all four graphs have the same general trends. The rms deviations are lowest for the highest places in the events, gets bigger in the middle of the pack, and then decreases at the lowest places. This illustrates one simple aspect of judging know to all judges, that it is easiest to pick out the best skaters, nearly as easy to pick out the worst skaters, and the devil is in the middle.
For singles and pairs, the spread in the judges' ordinals in the middle of the pack is about three times higher than at the top and bottom. At best, the judges' ordinals typically vary by about +1 ordinal for the highest and lowest places, and vary by about +3 ordinals in the middle.
For dance, the spread in ordinals for the middle of the pack is only twice that at the top and bottom. Further, at best the dance judges' ordinals typically vary by only about +1/2 ordinal for the highest and lowest places, and vary by about +1 ordinals in the middle. Of course, judges do not assign ordinals to 1/2 a place. What this means, instead, is that in the best cases dance judges have deviations of 1 ordinal or more relatively rarely.
The above graphs quantify something which should also come as no surprise. Dance judges show a much higher level of agreement in their ordinals than do judges in singles and pairs. Quantitatively, dance judges agree among themselves two to three times as well as do judges in singles and pairs, and have less disagreement sorting out the middle than do judges in singles and pairs.
3. Spread in the Ordinals
If all judges in an event were equally knowledgeable, equally skilled, and based their marks on identical criteria, then the variations in the judges' ordinals should reflect only random errors (a.k.a. differences in opinion) in the judging process. Were that the case, then the spreads in the judges' deviations as characterized by the rms deviations should be related to the frequency with which different deviations occur according to a simple mathematical law. For random errors, an rms deviation of 1 would mean that deviations of +1 or less should occur about 65% of the time, +2 or less 99% of the time, and +3 or more the remainder of the time.
The following graphs show the frequency with which different deviations occurred in each of the four events. The y-axis is the number of times a given deviation occurred and the x-axis is the value of the deviation.
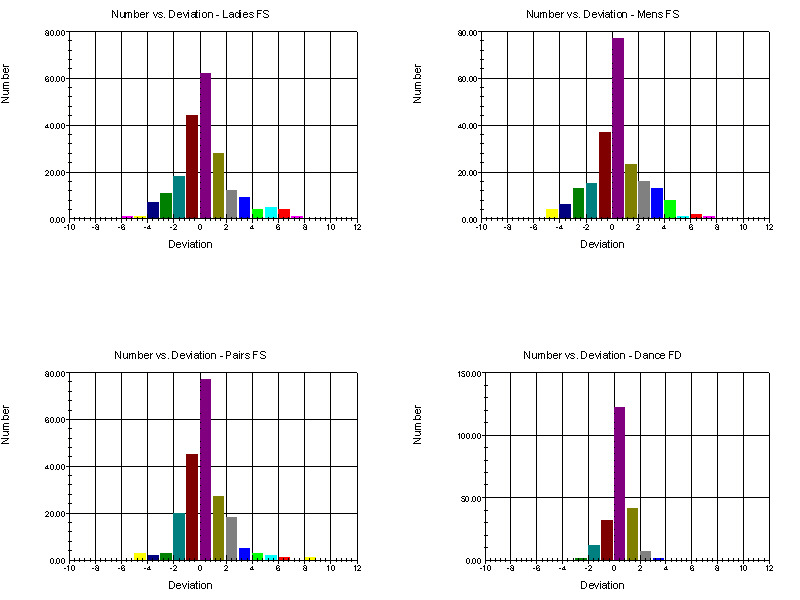
All four graphs are similar in that deviations of +2 or less are the most common, but for singles and pairs we see that large deviations are far more common than what is expected from random errors alone. Only in dance are the deviations consistent with a model of equally trained judges marking with small random differences of opinion.
The graphs of deviations shown above are composites for all the judges in each event. We can go one step further and look at the frequency of the deviations for each judge individually. When we do this we find that many of the large deviations in the above graphs are the result of large deviations from only a few judges. In each of the events we find examples of judges whose deviations include few large values and judges whose marks are sprayed all over the sheet. As one would expect from looking at the composite deviations, the occurrence of large deviations is less common among the dance judges than the singles and pairs judges.
The following graphs compare the distribution of deviations for what might be consider a good judge and a poor judge - at least in a statistical sense. Both judges were on the same panel in a non-dance event. [We are not identifying the event or judges as it is not our intent to embarrass anyone, and because we feel that a judges' performance should not be evaluated by looking at their performance on just one event.]
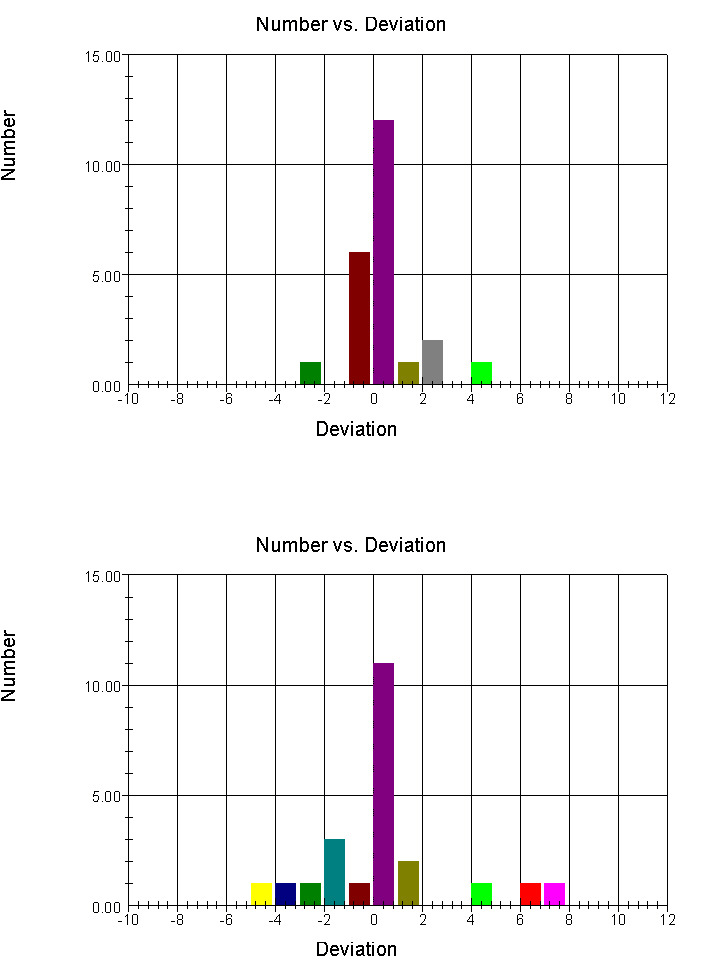
Note that for this example both judges were "on-panel" (deviations of 0) for about half the skaters in the event; but for the remainder of the skaters one judge was rarely off-panel by more than one place while the other judge would have done nearly as well by assigning random ordinals to the remaining skaters.
4. Marks
In the current method of scoring, the individual marks are only used as an intermediate step in getting to the ordinals. Because it is very difficult to train a panel of judges to mark on the same absolute scale, ordinals (the individual judges' orders of finish) are used to reduce the impact of the judges using different point scales on the final outcome. Nevertheless, the marks assigned by the judges are not totally arbitrary, and it is interesting to consider how the judges use their marks to get to their orders of finish. [In the following "place" refers to the order of finish as determined by the full panel while "ordinal" refers to the order of finish determined by an individual judge.]
We begin by looking at the spread of the judges marks for each place in the same way as we did for the ordinals. In this case we compare each judges' total mark for each place to the average total mark assigned by all the judges for that place. Again we calculate an rms; this time the rms total mark. Just like the rms deviation tells us about the spread in the ordinals for each place, the rms total mark tells us about the spread in total marks the judges gave for each place.
The following graphs show the rms marks for the different events. The y-axis is the rms total mark for each place and the x-axis is the place, from first to last.
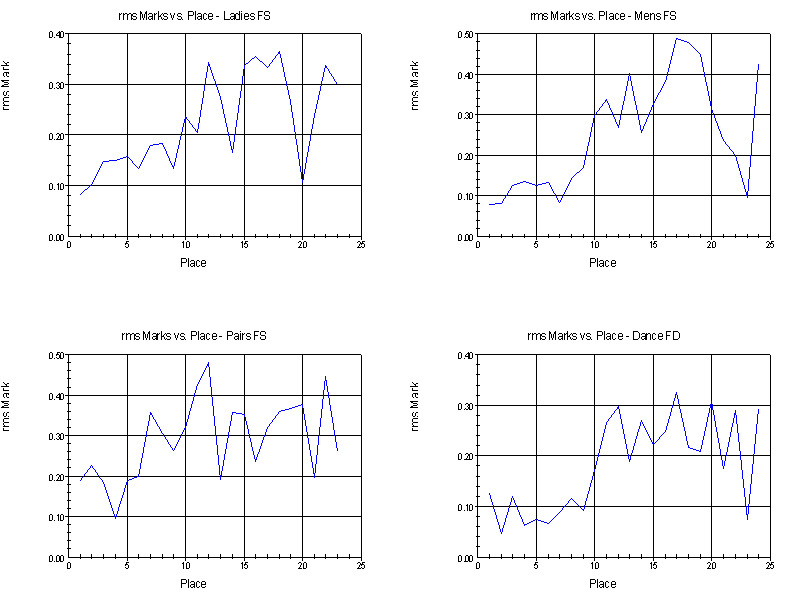
Similar to the graphs for the ordinals, the spread in the total marks is least for the higher places and increases in the middle. It does not, however, decrease at the bottom of the groups. Also similar to the graphs for the ordinals, the spread in the total marks for the dance event is lower than the spread in the total marks for singles and pairs. Overall, the spread in the judges' total marks for each place is in the range +0.1 to +0.3.
The spreads in the total marks illustrated in the above graphs are due to a combination of two factors. First there are the variations in the judges' standards of what a given place deserves in an absolute sense, and then there is their differences in opinion over who deserves that place. For example, part of the spread in the total marks for the skater finishing first results from what marks the judges think a first place finish deserves, and part results because not all the judges placed that skater first.
In order to see how consistent the individual judges' point scales really are we must look at the spread in the total marks calculated by ordinal, not by place. That is, we take the total marks for each ordinal (independent of who received that ordinal), calculate the rms total mark, and plot the results against the ordinal values. These graphs are shown below.
Similar to the first set of graphs, the spread in the marks gets larger as one gets closer to the bottom of each group. The above graphs, however, show a much smaller spread in total marks for a given ordinal compared with the previous graphs for a given place.
Together these two sets of graphs tell us how much of the spread in the total marks is due to variations among the judges' point scales and how much is due to diversity of opinion over the order of finish. They show that the individual point scales used by the judge are consistent with each other to within 0.1 to 0.2 in an absolute sense.
The differences between the above two sets of graphs, on the other hand, are an indication of how much of the spread in the total marks is due to the judges' diversity of opinion over the order of finish alone. As in the case of the rms deviations, that part of the spread in the total marks due to diversity of opinion regarding order of finish is greatest for the middle of each group than it is for the top and bottom, and is larger for singles and pairs than it is for dance.
The above results indicate that for senior events the judges have a pretty firm lock on the marks top performances deserve, but as they move lower in the groups they become more uncertain on an absolute scale. At the bottom of the groups, even though the judges are in fairly good agreement on the order of finish they are most uncertain about what total marks those performances deserve - even though the initial median marks given the judges at the start of each event intended to synchronize the judges apply to a skater near the bottom of the pack. It would appear that for Worlds events, the median marks have little impact on the intrinsic spread in the total marks used by the judges.
4. Marking on an Absolute Scale
A more detailed way of looking at the consistency of the judges' marking scales is to plot the total marks assigned by each judge vs. the ordinals the marks correspond to. The following graphs are obtained our four example events.
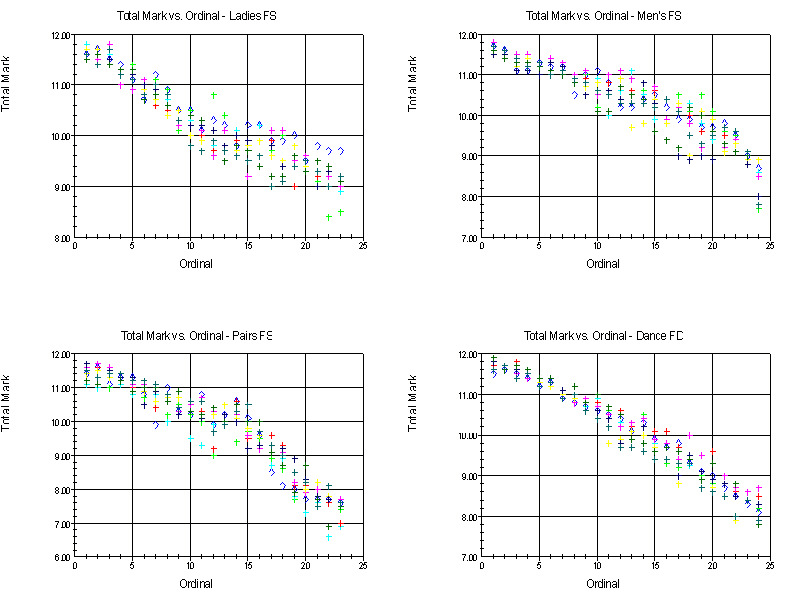
The first thing to notice about these graphs is that the spread in the marks increases as we go from the higher placing ordinals on the left to the lower placing ordinals on the right. This is the rms total marks vs. ordinals effect described in Section 3, where the rms total mark (spread in the marks) was shown to increase with increasing ordinal.
Next, notice that the four graphs have different non-linear shapes and span different ranges of total marks. Although the judges go into an event with some idea of the mid-point and the range of marks they expect to use, they do not arbitrarily string out the total marks in a straight line over an arbitrary range. All four graphs extend to slightly different marks at the high end and significantly different marks at the low end. We interpret these variations as at least an attempt on the part of the judges to assign marks that have some meaning in an absolute sense.
Most observers at Worlds, for example, would agree that the pairs event was the weakest of the four events with the quality of the top skaters below that seen in the late 1980's and early 1990's, and that the quality of the bottom teams was very weak, not even at the level of decent junior teams. Quantitatively, this is confirmed by looking at the marks assigned. Of the four events, both the average mark for the first place ordinal and the average mark for the last place ordinal have their lowest values in the pairs event. In fact, the graph of average total mark vs. ordinal for the pairs event is the lowest of the four events and falls off significantly faster for the bottom third of the group than for the other three events.
The level of internal consistency of the judges' point scales can also be examined by comparing the average difference between each judges' marks and the average mark for each ordinal (in other words, the average deviations in the total marks). For all four events, the point scale for 64% of the judges differed from the average point scale by no more than 0.1, for 92% of the judges it differed by no than 0.2, and in no case did it differ by more than 0.3. This agrees with the conclusion in Section 3. that the judges point scales agree with each other to within 0.1 to 0.2 points. These small differences between the judges' point scales can be more clearly seen in the graphs of total mark vs. ordinal if we add trend line for each judge. The following graph the pairs event is a typical example. The trend lines show the smoothed relation between total mark and ordinal for each judge.
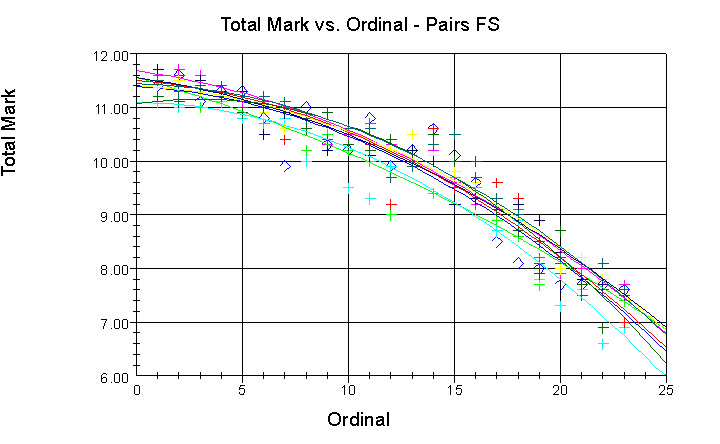
One can see small vertical shifts between the different curves, again indicating internal consistency in the overall scale of the total marks at the level of about 0.2 points. Notice also that all nine curves have basically the same shape.
Although there is good agreement in the general trends for the individual judges' point scales and the offsets between their point scales, there are still significant variations in the point differences individual judges assign between consecutive ordinals. These point differences are typical no larger than 0.3, but values several times larger are also found. It is this spread in the first differences for the judges' individual point scales that the ordinal method is designed to ignore.
5. The Individual Marks
The statistical characteristics of the individual marks are very similar to the characteristics of the total marks when analyzed with respect to the panel's placement of the skaters. Agreement among the judges is again at the level of 0.1 to 0.2 points in an absolute sense. There is also good agreement among the judges in the relative values of the first and second mark for the individual skaters; i.e., panels go up or down on these marks for the individual skaters as a group, with the judges consistent with each other at a level of about 0.1 to 0.2 points.
There is little to be gained, though, in comparing the individual marks to the judges' ordinals, since only the total marks and the ordinals are directly related to each other as alternate numerical representations of the judges' orders of finish, and the individual marks are not. In mathematical terminology - while the ordinals and the total marks are expected to be correlated (related to each other), the ordinals and individual marks are not, since the individual marks depend on the specific mix of "technical" and "artistic" skills of the individual skaters, and many combinations of individual marks can result in the same total mark and ordinal.
6. So What?
From the above we draw the following conclusions:
For singles and pairs, the spread of opinion in the judges' ordinals for the placement of a given skater/team is three times worse for the middle of a group of skaters/teams than it is for the top and bottom skaters/teams.
For dance, the spread of opinion in the judges' ordinals for the placement of a given couple is two times worse for the middle of a group of couples than it is for the top and bottom couples.
For dance, the spread of opinion in the judges' ordinals for a given place is 1/2 to 1/3 what is found in singles and pairs.
The spread in the total marks used by the judges increases from top to bottom within a group of competitors, and is larger for singles and pairs than it is for dance.
Although judges are fairly consistent in identifying the bottom of a group of competitors, their total marks are least consistent for those skaters. The use of the initial median marks does not seem to be of much help to the judges in this respect.
The judges' deviations for dance are consistent with a model of small random differences of opinion among the judges with a range of about 1/2 to 1 ordinal.
The judges' deviations for singles and pairs is only roughly in agreement with a model of small random differences of opinion with a range of about 1 to 2 ordinals, with large deviations (more than 3) occurring too frequently.
The anomalous frequency of occurrence of large deviations in singles and pairs can be traced to the performance of a small number of judges on each panel.
The individual judges' point scales agree fairly well with each other and are internally consistent to within about 0.2 points.
Judges on a panel are consistent with each other in their use of the first and second marks in evaluating "technical" skaters vs. "artistic" skaters at a level of about 0.1 points.
Judges appear to use a range of marks that is indicative of the total overall quality of the skaters in the group.
The mathematical relationship between total marks and ordinals for the four skating events are different for each event, and suggests that the judges' marks are indicative of the relative quality of the performances beyond a simple order of finish - limited primarily by those situations where judges get caught in their marks.
Although not consciously intending to, judges at Worlds appear to mark on a roughly absolute scale, internal consistent at a level of 0.1 to 0.2 in the total mark at best, and about 0.2 to 0.3 at worst for the lowest places.
The number of "problem" judges and/or marks that can be statistically identified make up a small fraction of the total judges/marks involved in a competition. For the most part, the judges at Worlds are generally "all on the same page" when it comes to evaluating performances. There is no statistical evidence for the widespread collusion or incompetence that judges are sometimes accused of. On the contrary, this evaluation of judging performance indicates that for the most part Worlds judges are a fairly uniformly trained group of individuals, "calibrated" to a consistency of about 2-3% - about the best one could hope for in a subjective sport evaluated by humans.
Knowing how judges use their marks in the real world has applications in at least four areas - or so we suggest.
In fairness to the skaters, decisions to change the judging-process /scoring-system should be based on how judges are really capable of performing, not anecdotal opinions. These issues are more complex and subtle than most people acknowledge, and the sad fact is that the vast majority of people in the skating community don't really understand the mathematics of scoring systems in general, or the ordinal system in particular (and apparently don't care - see below). Calculations which compare the mathematical characteristics of different scoring systems require knowledge of the real world characteristics of judges' marks if the calculations are to have any meaning. The calculations we have been reporting in ISIO make use of the real world judging performance characteristics describe here.
In the training of new judges, trial judge performance is compared to the results of the official panel in a grossly simplified way. A more sophisticated look at the way judges use their marks offers the opportunity to train better judges, and to improve the performance of current judges, by identifying specific areas or situations where judges are having trouble.
Judges are frequently criticized for a variety of sins - usually unfairly, but not always. All judges, no matter how good they are at it, occasionally give bonehead marks, and knowledge of real world judging can deflect some of this criticism by making clear what really is unusual and what is not. Still, the current "deviation of 3" approach to monitoring judges' performance is far too simplistic. A detailed statistical comparison of individual judges' performance to actual judging characteristics could be a useful tool for monitoring/improving judging performance - and might eliminate the element of witch-hunting that occasionally characterizes the judges accountability issue.
Based on the marks from a single competition, it is nearly impossible to identify subtle incidents of judges' bias (either conscious or unconscious). Knowledge of real world judging characteristics applied over several competitions offers the opportunity to weed out subtle biases that would otherwise go unnoticed.
While working on the calculations for this article I made the mistake of discussing them at a local competition at which several current and former high level domestic skating officials were present, as well as some National and International judges. By the time the referee rescued me I was surrounded by an animated group of nearly a dozen judges with several hundred years of cumulative judging experience simultaneously telling me what a moron I was. They were, in short, a skeptical group. Some of the points made to me are offered without comment. You can decide for yourself which of these you agree with.
You can't mathematically quantify the nature if the judging process, so this is all a waste of time.
The problem is not in the scoring system, it is in the training of the judges.
People have been thinking about the scoring system for a long time. If a better system existed we would be using it already.
Judges intent on "cheating" the system know the best way to do it is to use small adjustments to their marks; therefore, there is no reason to be concerned how different scoring systems react to large errors in the marks.
It is all subjective, there is no real right or wrong answer; therefore, there is no reason to consider changing the scoring system.
We end with the disclaimer we began with. This analysis applies only to the marking of senior level events at the World Championships in the period 1994 to 1997. One can expect significant differences in the marking characteristics for the judging of lower level events, and remind those who champion various changes in the scoring system: any new scoring system adopted must not only work for the best senior skaters, but also for the worst pre-preliminary event at you local skating club.